Wadih Pazos
Wadih founded both PairSoft and PaperSave. He is an avid technologist who specializes in streamlining operations and maximizing productivity.
View all posts by Wadih PazosWadih Pazos • April 27, 2022

When synthesized properly, analytics reports and data visualization can bring actionable insights to key people in your organization as they relate to the invoice handling process. In fact, with access to peer benchmarks and key performance indicators, analytics supports efficiency and sustainability initiatives while improving cashflow visibility overall. That’s why utilizing a centralized platform that showcases the metrics and key performance indicators (KPIs) that matter the most can help fuel your company’s growth.
Every business struggles to make sense of their organizational data at one point or another. But when your team has access to real-time data such as page views, conversion rates, and other important metrics, they can gain crystal-clear insights into the sales and marketing functions. Analytics dashboards provide a visualization of data in static or interactive layouts including flexible views, graphs, multi-tabbed presentations, and modification options for users.
To use these dashboards effectively, an organization will select any number of KPIs to measure. These values help indicate whether a process, strategy, or campaign is effective. When KPIs are measured against target goals, competitive performance, or past performance, a business can make strategic decisions about the future.
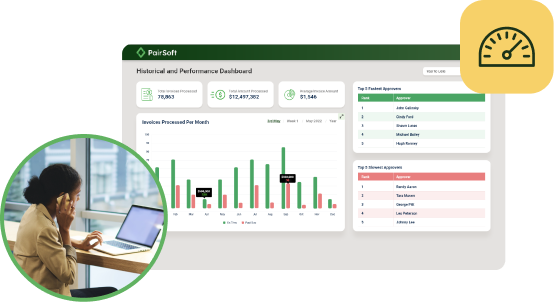
For example, valuable metrics such as invoice approval times, number of invoices processed annually, and invoice cycle times can be be visually displayed on a customized analytics dashboard to unlock invaluable intelligence.
PairSoft is on a mission to bring enterprise capabilities to the mid-market. Our upcoming launch of Analytics, the latest new feature to be added to the Papersave 7 Cloud solution, is a great example of plug-and-play dashboards that offer real-time KPIs and metrics at a glance — with full drill-down functionality.
This trailblazing product can also help you unlock competitive intelligence on how your company’s invoice processing performance compares to direct and adjacent competitors. Keeping a pulse on the competitive landscape can help boost a company’s bottom line over the long term.
Because PairSoft represents a cloud-based AP-focused community, we’ve been able to anonymize process data, placing peer benchmark KPIs directly into the AP Manager’s dashboard. At present, it’s only available in the Enterprise Package and it includes role-based dashboards, industry standard KPIs, sustainability metrics, and even peer benchmarking.
Want to know more about our new analytics capability? Watch our webinar and schedule a free demo to find out how PairSoft’s Analytics can help your business outpace the competition today.


